Examples · Target 96 · two plates
Obesity and diabetes (PAD000040)#
Every step on real data: two raw plate files from a free public dataset, to quality-checked, bridged data with its sample metadata. Every output is real.
1. Get the data#
PAD000040 from the PRIDE archive (free to use, CC0): Olink Target 96 Inflammation, 92 proteins, 142 people with severe obesity, two plates, diabetes status. Download three files from PRIDE: PAD000040 into one folder:
| File | What it is |
|---|---|
inflam_NASH_dt1.raw.csv |
plate 1, raw |
inflam_PRA_dt2.raw.csv |
plate 2, raw |
2025.05.08_sample_manifest.xlsx |
the sample list, with diabetes status |
Milito MM, …, Giraudi PJ. Inflammatory proteomic heterogeneity beyond glycemia status in severe obesity. Int J Mol Sci 2026;27(9):4152. doi:10.3390/ijms27094152
2. Read the two plates#
import pandas as pd
import signatomics.olink as so

plates = pd.concat([so.read_npx("inflam_NASH_dt1.raw.csv"),
                    so.read_npx("inflam_PRA_dt2.raw.csv")], ignore_index=True)
The reading report of plate 2:
Reading report
  file: inflam_PRA_dt2.raw.csv
  file type: .csv
  layout: long format (one row per sample and assay)
  columns renamed to the names signatomics uses: PlateLOD -> LOD
  NPX: 184 cells said No Data, read as missing values
  MissingFreq (missing frequency): percentages ("12%") read as fractions (0.12)
  result: 8096 rows = 88 samples x 92 assays
The result is the standard table: one row per sample and assay.
3. Quality control#
The diabetes status is in the sample list, so the quality check looks it up there:
manifest = "2025.05.08_sample_manifest.xlsx"
so.qc_report(plates, group="diabetes", samples=manifest, on="FIF ID", show_ids=False)
Quality report
  data: 178 measurements of 143 samples, 92 assays, 2 plates
  QC status: 161 PASS, 17 WARN, 0 FAIL
  WARNING empty measurements (no NPX value at all): 2 (IDs hidden)
  bridge samples (on more than one plate): 35
  assays below the LOD in more than 75% of the samples: 8 of 92 (a sign of data quality; they stay in)
  outliers: 1 of 178 measurements (IDs hidden); see plot_sample_qc
  WARNING group mixed up with plate: 'Prediabetes' is missing from Inflammation F.I.F 21/03/2024. A plate difference can then look like a group difference: bridge the plates before comparing groups.
Two findings matter here. People with prediabetes were measured only on plate 2 (or on both), so a plate difference would look like a diabetes difference: bridge before comparing.
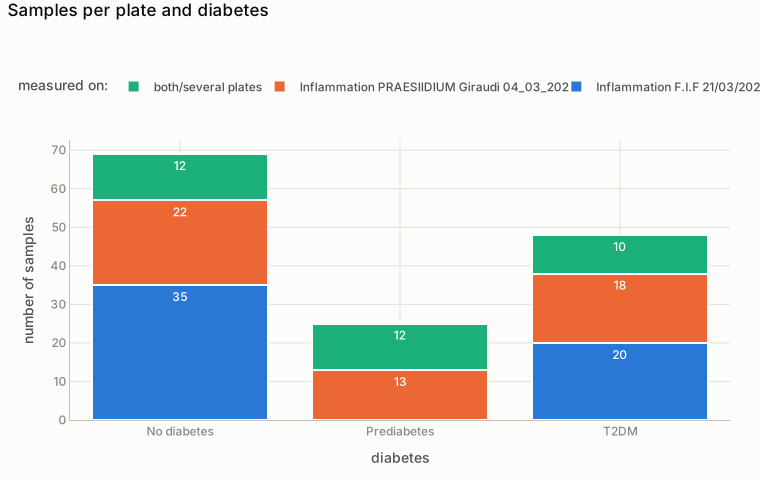
so.plot_group_by_plate(plates, "diabetes", samples=manifest, on="FIF ID"). Nobody with prediabetes was measured on plate 1 alone.
And one measurement looks odd: sample 249 on plate 2, about 5 NPX too low on almost every protein.
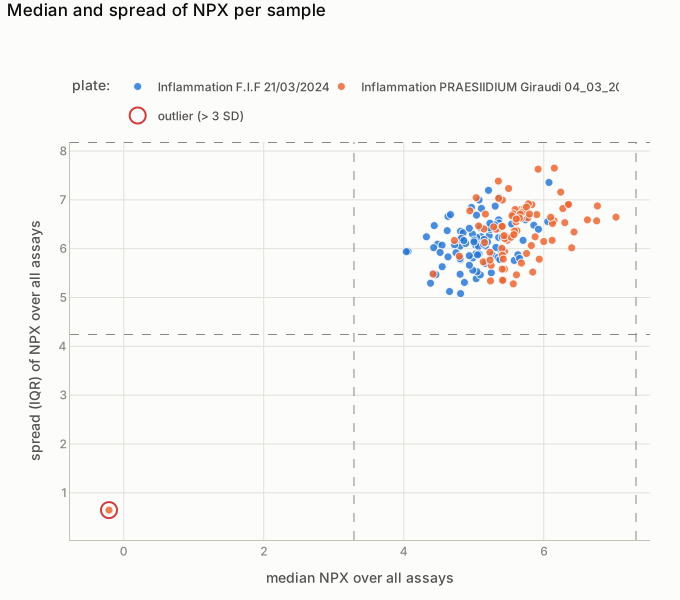
so.plot_sample_qc(plates). Each dot is one measurement; the red ring, far to the left, is sample 249 on plate 2.
Quality steps applied
  removed 2 measurements (no NPX value at all): 2 (IDs hidden)
  kept: 176 measurements of 143 samples, 92 assays
Every protein stays unless you give a threshold (max_below_lod=): a protein undetectable in
one group and measurable in another can itself be a biomarker. To remove the odd measurement as
well, see Quality control.
4. Bridging#
Bridging check
  reference: Inflammation F.I.F 21/03/2024
  Inflammation PRAESIIDIUM Giraudi 04_03_2025: reads +0.52 NPX compared with Inflammation F.I.F 21/03/2024 (median over assays; per assay -0.96 to +2.30), measured on 29 bridge samples
    assays shifted by more than 0.1 NPX: 83 of 92 - bridging needed
    noise: the bridge samples' differences spread 0.44 NPX per assay (typical IQR); bridging removes the shift; this noise stays
    bridge samples that shift differently from the others (a mix-up or a degraded tube?): 2 (IDs hidden)
  'diabetes' among the bridge samples: No diabetes: 9 of 69; T2DM: 9 of 48; Prediabetes: 10 of 25
    overall shift on Inflammation PRAESIIDIUM Giraudi 04_03_2025 per group: No diabetes +0.56; Prediabetes +0.57; T2DM +0.53 (largest difference 0.04 NPX)
    assays whose shift differs by more than 0.5 NPX between groups: IL13, IL-22 RA1, TNFB, 4E-BP1, IL-24, IL2 - with few bridge samples per group this is often noise; look at them before trusting group differences for these assays
Plate 2 differs from plate 1 by −0.96 to +2.30 NPX depending on the protein, so each protein gets its own correction. Overall the shift is the same in every diabetes group. Six assays shift differently between groups, each measured on only 9 or 10 bridge samples per group: look at those before trusting a diabetes difference in them.
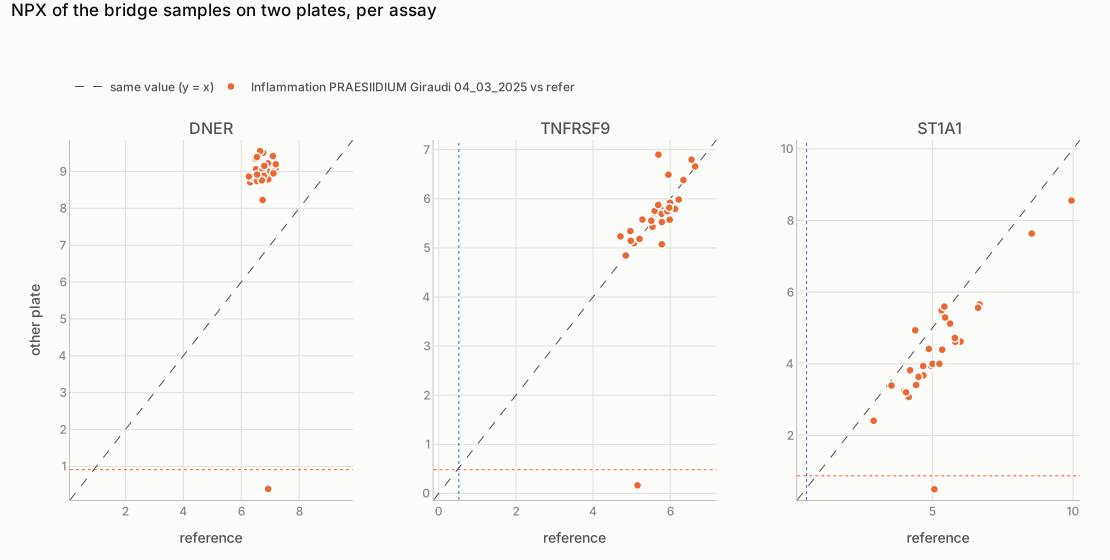
so.plot_bridge_scatter(clean, ["DNER", "TNFRSF9", "ST1A1"]). On the diagonal both plates agree. Plate 2 reads DNER 2.3 NPX higher, TNFRSF9 the same, and ST1A1 about 1 NPX lower. The dot at the bottom of each panel is sample 249, the broken tube.
How bridging corrects this, for one protein:
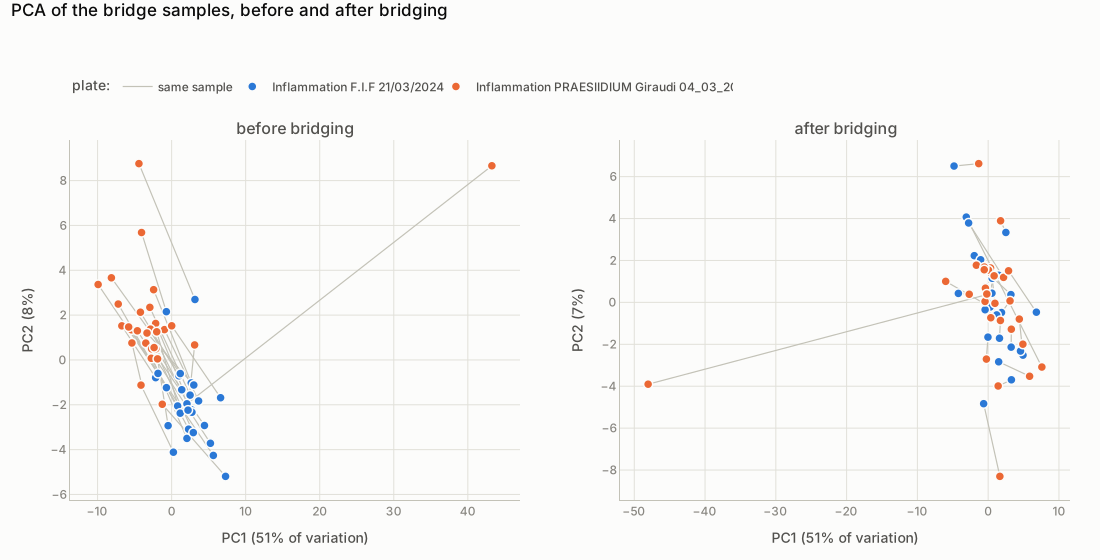
so.plot_bridge_pca(clean, bridged). Each line joins one sample's two measurements; the point far from the rest in both panels is sample 249.
Before bridging, a sample's two measurements lie 6.5 apart in the PCA (median); after, 1.8, and
the plates overlap. The PCA is the independent check: bridge_plates fits one shift per protein,
so per-protein checks look perfect by construction, while the PCA looks at all proteins together.
5. Add the sample metadata#
Matching report
  matched on: SampleID (NPX data) = FIF ID (your sample metadata)
  matched: 142 of 143 sample IDs in the NPX data
  WARNING missing from your sample metadata (kept, without sample metadata): 249
  columns in both tables (yours renamed with the ending _samplelist): PlateID
on names the ID column in the sample list. Sample 249 has no row there: it stays in the data,
listed in the report.
Next#
The reference has every function with all its options.