Preprocessing · when your samples are on several plates
Bridging#
Use this when your samples were measured on several plates or in several projects, and some samples were measured on both: the bridge samples. With one plate, go straight to Sample metadata.
The example comes with a second plate. Read both, apply quality control, then bridge:
import pandas as pd

data = pd.concat([so.read_npx(so.example_file(1)),
                  so.read_npx(so.example_file(2))], ignore_index=True)
clean = so.apply_qc(data)

so.bridge_check(clean)                  # look: how different are the plates?
combined = so.bridge_plates(clean)      # act: put them on one scale
On the synthetic example files: the check
Bridging check
  reference: Plate 1
  Plate 2: reads +0.51 NPX compared with Plate 1 (median over assays; per assay -1.05 to +1.67), measured on 12 bridge samples
    assays shifted by more than 0.1 NPX: 83 of 92 - bridging needed
    noise: the bridge samples' differences spread 0.47 NPX per assay (typical IQR); bridging removes the shift; this noise stays
    bridge samples that shift differently from the others (a mix-up or a degraded tube?): P33
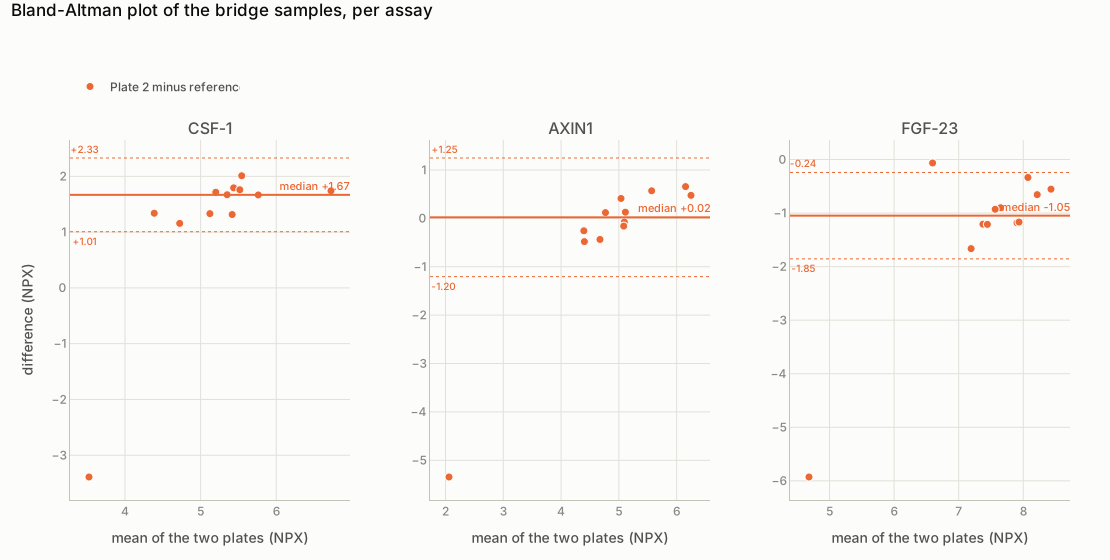
so.plot_bridge_bland_altman(clean): how much the plates differ, before bridging, for three proteins chosen from the data (the largest shift up, about none, the largest shift down). Each point is one bridge sample: the mean of its two measurements (left to right) and the difference, Plate 2 minus Plate 1 (bottom to top). The solid line is the median difference: the shift that bridging removes, different for each protein. Between the dotted lines lie the usual differences (median ± 1.96 robust SD). The point far below in each panel is P33, the broken tube.
Plate 2 reads higher than Plate 1, by a different amount for each assay, so each assay gets its own correction.
On the synthetic example files: the bridging
Bridging report
  reference (kept as it is): Plate 1
  Plate 2: 92 assays adjusted by their adjustment factor (median -0.51 NPX, from -1.67 to +1.05), each from 12 bridge samples
  NPX and LOD shifted together, so 'below the LOD' stays the same; the original values are in NPX_unbridged and LOD_unbridged
  check: plot_bridge_pca(before, after) - each bridge sample's two measurements should now lie together
The adjustment factor of an assay is the median of its bridge samples' differences between the two plates, as in Olink's bridge normalization. The median keeps one broken tube, like P33, from pulling it.
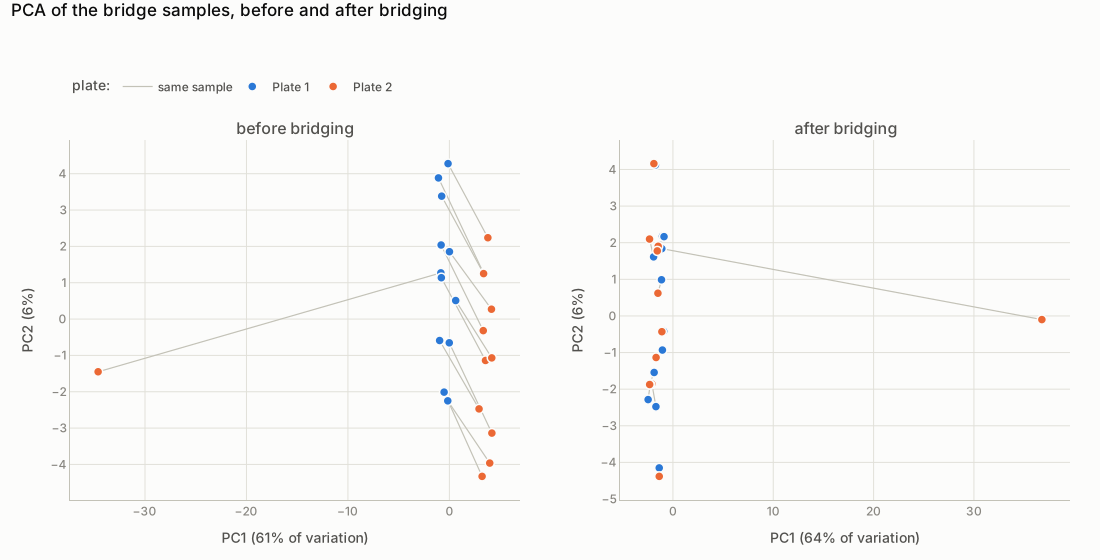
so.plot_bridge_pca(clean, combined): check that it worked. Each line joins one bridge sample's two measurements. After bridging they lie close together and the plates overlap. The point far from the rest is P33, the broken tube.
Which plate is the reference, and can I choose it?
By default the plate with the most samples: its values stay as they are and the other plates move to its scale. To choose another:
How many bridge samples do I need, and can I use only some?
Olink recommends 8 to 16 for Target 96, and more for Explore and Reveal. To use only some, for example after removing a broken one:
My data comes from two projects. Can I bridge projects?
Yes: name the column that holds the project.
Can I save the adjustment factors and use them again later?
Is the shift the same in every group?
The report then shows the shift per group. If one group shifts differently, bridging could add or remove a group difference.
Check yourself: after bridging, bridge_check shows shifts of about 0. Does that prove it worked?
The adjustment factors were computed from these same bridge samples, so their shifts are about 0 by construction. The independent check is the PCA, which looks at all assays together.
Every option: bridge_check, bridge_plates and the charts in Functions.