Statistical analysis · step 2
Compare groups#
- Analysis table
- Compare groups
- Correlate
Use this when you want to know which assays differ between groups, such as cases and controls: every assay is tested, with the same test, and the results are corrected for testing many assays at once.
from signatomics.stats import compare_groups, plot_volcano

result = compare_groups(table, "group", reference="control")
plot_volcano(result)
reference is required: every difference is "other group minus reference", so here a positive
difference means higher in cases.
On the synthetic example files, without P07 and P33
Group comparison
  test: Welch's t-test; effect: difference in mean NPX (= log2 fold change), case minus control, with 95% interval
  groups: control 28, case 29 (reference: control)
  tested: 92 proteins
  FDR below 0.05: 3 proteins: IL-17C (+1.27 NPX, FDR 2.2e-07), OSM (+1.02 NPX, FDR 4.0e-07), IL6 (+0.93 NPX, FDR 1.3e-04)
Reading the result#
result.table has one row per assay, the clearest first:
protein  mean_control  mean_case  difference  ci_low  ci_high        p      fdr
 IL-17C          2.51       3.79        1.27    0.92     1.63 2.35e-09 2.16e-07
    OSM          7.39       8.41        1.02   0.716     1.32 8.72e-09 4.01e-07
    IL6          4.46       5.38       0.928   0.564     1.29 4.22e-06 0.000129
    HGF          8.96       9.58       0.624   0.125     1.12   0.0153     0.35
   IL18          4.24       3.84      -0.391  -0.717  -0.0657   0.0194     0.35
| Column | What it means |
|---|---|
difference |
mean NPX of cases minus controls. NPX is a log2 scale, so this is the log2 fold change: +1 means twice as much protein in cases, +1.27 about 2.4 times |
ci_low, ci_high |
the 95% interval: the differences the data are compatible with |
p |
how surprising the difference would be if the groups did not differ, for this one assay |
fdr |
the p-value corrected for testing 92 assays (Benjamini-Hochberg). Read this one: among the assays with an FDR below 0.05, on average at most 5% are false findings |
IL-17C, OSM and IL6 are clearly higher in cases. HGF has a small p-value (0.015), but with 92 assays tested, one such value is expected by chance: its FDR is 0.35. In the synthetic data HGF and CXCL10 do differ a little; with about 29 people per group, the evidence for them stays unclear. An FDR above 0.05 means unclear, which is a weaker statement than no difference.
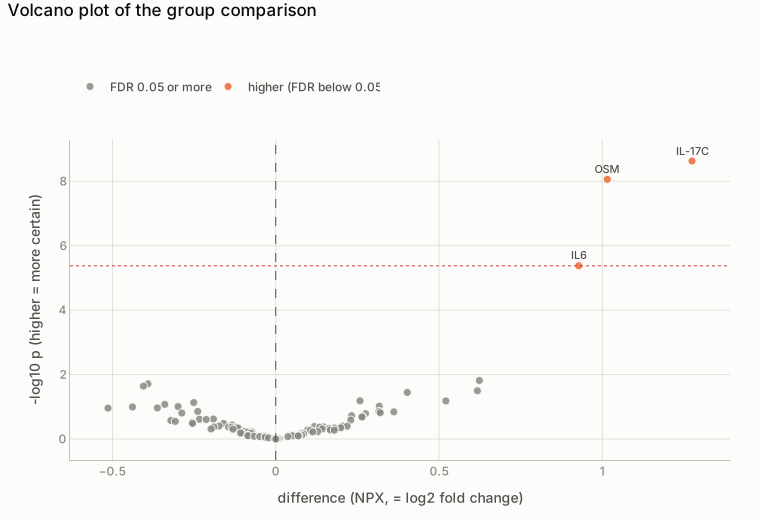
plot_volcano(result): every assay at once. Left to right: the difference (log2 fold change); bottom to top: how certain it is (-log10 p). Above the dotted line the FDR is below 0.05. Hover a dot for its numbers.
Why the broken samples matter#
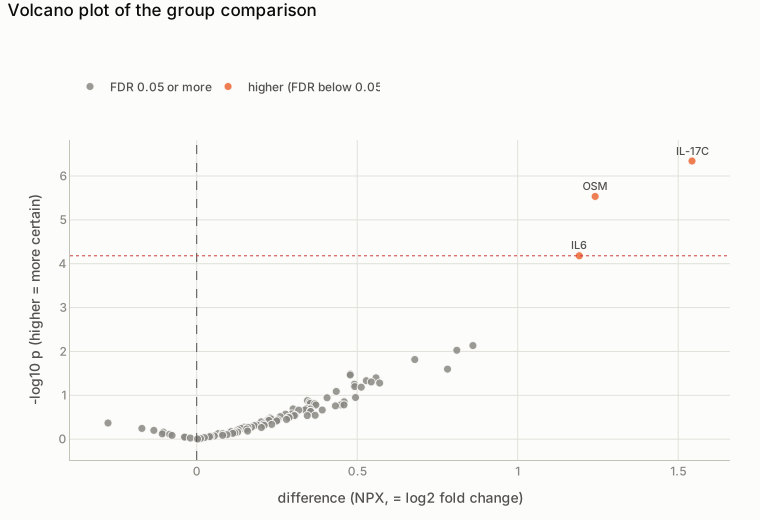
The same comparison with P07 and P33 still in. Both are controls that read about 5 NPX too low on every assay, so almost every assay looks higher in cases. This is why quality control flags outliers and you decide what to do with them.
Why Welch's t-test, and why no normality test first?
Welch's t-test lets each group have its own spread, which keeps the error rate right when groups differ in size and spread. NPX is already on a log scale, where Welch works well at usual study sizes. Choosing the test per assay after a normality test makes the choice depend on the sample size more than on the data, and mixes different tests in one FDR. So one test is chosen up front, for every assay.
Can I use a rank-based test instead?
The Mann-Whitney U test, with the Hodges-Lehmann shift as the difference (the median of all differences between a case and a control). Useful with small groups or a few extreme values. On the example it finds the same three assays.
I have three or more groups, or groups in an order. What then?
Three or more groups: Welch's ANOVA tests whether any group differs, then every pair is
compared (read result.pairwise, Holm-adjusted). Groups in a natural order (for example
normal, prediabetes, diabetes): one trend test, with the slope per step.
Can I see how often each assay is below the LOD in each group?
below = so.to_wide(data, values="below_lod").drop(["P07", "P33"])
result = compare_groups(table, "group", reference="control", below_lod=below)
The table then gets below_lod_control and below_lod_case. IL-17C is below the LOD in 39%
of the controls and in none of the cases: detectable mostly in cases, which is itself part
of the finding.
Check yourself: an assay has p = 0.02 and FDR = 0.40. Does it differ between the groups?
Unclear. With 92 assays tested, a p-value of 0.02 is expected for about two assays by chance alone; the FDR of 0.40 says so. A larger study, or a second cohort, can tell.
Every option: compare_groups and plot_volcano in Functions.