Start
Start in 5 minutes#
The four preprocessing steps on synthetic NPX data that comes with signatomics, so you get exactly the output shown here.
1. Install#
Needs Python 3.10 or newer. signatomics installs from GitHub until it is on the
Python package index; [olink] adds what the Olink part needs (reading
.xlsx and .parquet files, charts).
2. Data import#
import signatomics.olink as so

data = so.read_npx(so.example_file())      # your own file: so.read_npx("my_npx_file.csv")
so.example_file() gives the path to a synthetic NPX file that comes with signatomics: one
Target 96 plate with 40 samples, 8 controls and 92 assays. Synthetic means the values are
generated to look like real Olink data, without any person or study behind them.
On the synthetic example file
3. Quality control#
so.qc_report(data)                # look: your data stays as it is
so.plot_npx_strip(data)           # every value per assay, with the LOD
clean = so.apply_qc(data)         # act: removes controls and FAIL samples
On the synthetic example file
Quality report
  controls (left out of the checks below; apply_qc removes them): 8 control samples (3 NEGATIVE_CONTROL, 3 PLATE_CONTROL, 2 SAMPLE_CONTROL)
  data: 40 samples, 92 assays, 1 plate
  QC status: 38 PASS, 1 WARN, 1 FAIL
  assays below the LOD in more than 75% of the samples: 11 of 92 (a sign of data quality; they stay in)
  outliers: 1 of 40 samples (P07); see plot_sample_qc
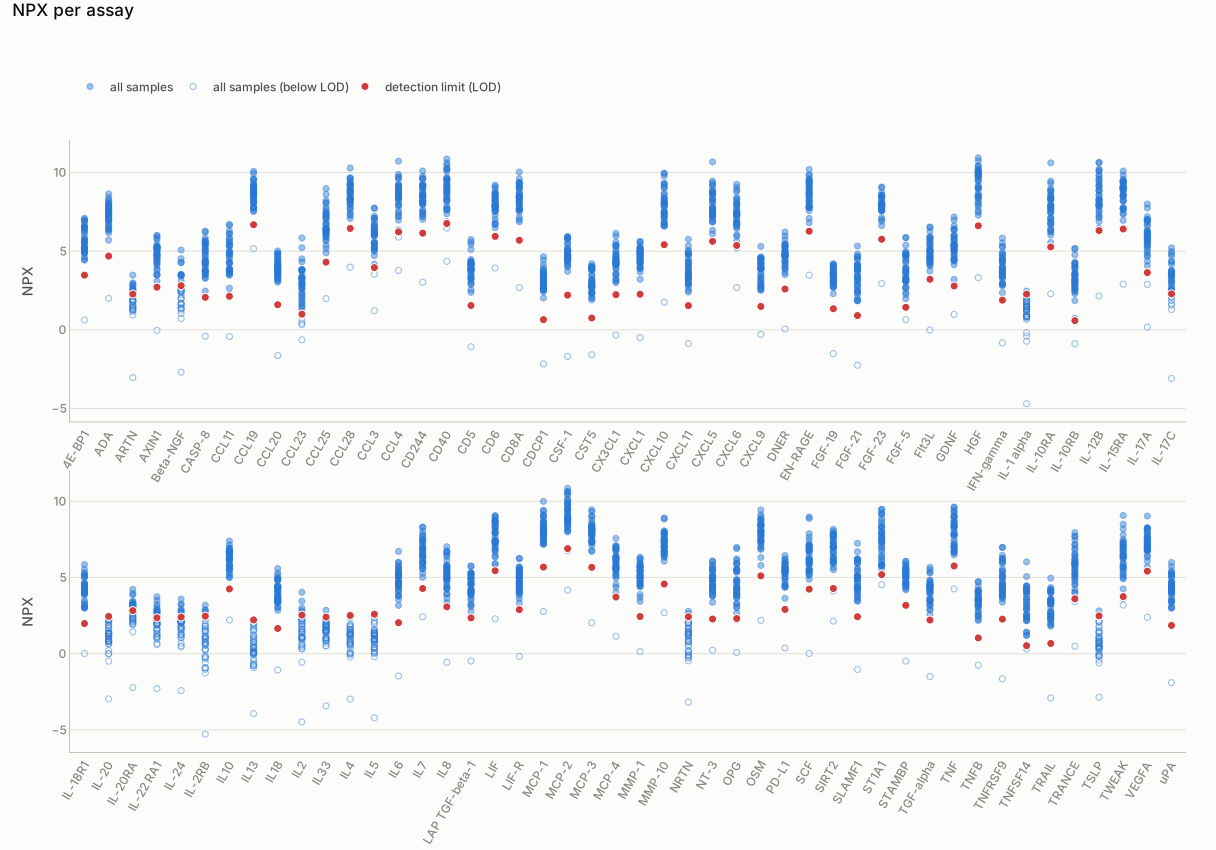
so.plot_npx_strip(data). Each dot is one sample's NPX value for one assay; the red dot is the assay's detection limit (LOD), and hollow dots lie below it. Hover a dot for its value.
4. Bridging optional: for samples on several plates#
The example has a second plate; 12 samples are on both.
import pandas as pd

both = pd.concat([so.read_npx(so.example_file(1)), so.read_npx(so.example_file(2))],
                 ignore_index=True)
clean = so.apply_qc(both)
combined = so.bridge_plates(clean)     # plate 2 on the scale of plate 1
On the synthetic example files
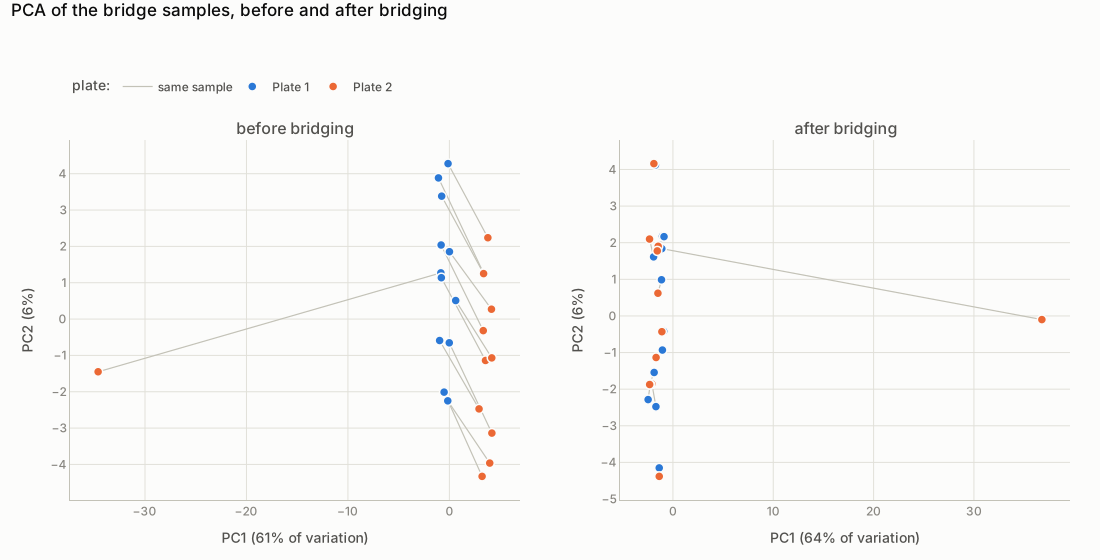
so.plot_bridge_pca(clean, combined). Each line joins one bridge sample's two measurements: after bridging they lie together and the plates overlap. The point far from the rest is P33, the broken tube.
5. Sample metadata#
On the synthetic example files
Your sample metadata (demographics, clinical data, ...) now sits next to the NPX values. P20 is missing because quality control removed it (QC status FAIL).
All of it in one call#
prepare runs the four steps with their default choices and prints one short report, with a
list of what to look at yourself (such as the outlier P07). See In one call.