Quality control#
Quality control has two halves: first look (qc_report and the
charts), then decide (apply_qc).
qc_report#
Look at data quality. Your data stays as it is.
qc_report(npx, *, group=None, samples=None, on=None, max_below_lod=0.75, outlier_sd=3.0,
          show_ids=True, verbose=True) -> QCReport
It checks:
- control samples and control assays (from
SampleTypeandAssayType; in files withoutSampleType, sample IDs that look like controls, such asNEG CTRLorCONTROL_SAMPLE, get a warning); - rows without a sample ID;
- QC status per measurement: PASS, WARN or FAIL (older Target 96 exports: Pass / Warning);
- completely empty measurements;
- samples measured twice on the same plate (duplicate sample IDs) and bridge samples;
- assays below the LOD in more than 75% of the samples (a sign of data quality);
- outliers: samples whose median or spread over all assays lies more than 3 SD from the others (Olink's standard sample check), reported as a count with their IDs.
With group, it also checks whether a group is missing from a plate, and whether
detectability differs between groups.
Inputs
| Argument | Type | Default | Meaning |
|---|---|---|---|
npx |
DataFrame | — | table from read_npx |
group |
str | None |
a column of your sample metadata, e.g. "diabetes" |
samples |
path or DataFrame | None |
your sample metadata, when group is a column there: it is only looked up, and npx stays as it is |
on |
str | None |
with samples: the column that holds the same IDs as SampleID |
max_below_lod |
float 0–1 | 0.75 |
assays below the LOD in more than this share of the samples are reported, as a sign of data quality; they stay in the data |
outlier_sd |
float | 3.0 |
a measurement whose median or IQR over all proteins is more than this many standard deviations from the mean (per panel) is reported as odd |
show_ids |
bool | True |
list sample IDs; False gives counts only |
verbose |
bool | True |
print the report |
Output. A QCReport object. It prints as a readable report and displays neatly in a
notebook. The tables behind the report are its attributes:
| Attribute | What it holds |
|---|---|
.lines |
the report lines (list of text) |
.measurements |
one row per measurement: the ID columns, values, missing, qc_warning, and True/False flags empty, warning, repeat, bridging |
.plates |
one row per plate: measurements, warnings, empty |
.proteins |
one row per protein: below_lod (share 0–1), missing (share empty) |
.samples |
one row per measurement: median and iqr of its values over all proteins, the limits median_low, median_high, iqr_low, iqr_high, and outlier (True/False). The table behind plot_sample_qc |
.group_by_plate |
with group: number of samples of each group per plate (column both/several plates for bridge samples) |
.below_lod_by_group |
with group: one row per protein (index Assay), one column per group with the share below LOD (0–1), and difference (largest minus smallest share), sorted by difference |
Warnings in the report
- Group missing from a plate: a group that was never measured on a plate holding at least 5 samples. Plate differences could then look like group differences.
- Detectability differs: proteins far more often below the LOD in one group than in another (by 30 percentage points or more). Keep these: being undetectable in one group can itself be a signal.
- Outliers point to a technical problem (dilution, haemolysis, a pipetting
error). If you decide to remove one, do it with
apply_qc(drop_samples=...)so that the removal is reported.
Why a group missing from a plate matters:
bridge_check(..., group=...)).Samples without sample metadata (no match in your sample metadata) are left out of the group counts.
Errors. KeyError when group is missing from the columns: give samples= and on=. ValueError for samples without on.
Example
rep = so.qc_report(data, group="diabetes", samples="sample_manifest.xlsx", on="FIF ID",
                   show_ids=False)
rep.group_by_plate          # the table behind the group-and-plate warning
rep.samples[rep.samples["outlier"]]
Quality report
  data: 178 measurements of 143 samples, 92 assays, 2 plates
  QC status: 161 PASS, 17 WARN, 0 FAIL
  WARNING empty measurements (no NPX value at all): 2 (IDs hidden)
  bridge samples (on more than one plate): 35
  assays below the LOD in more than 75% of the samples: 8 of 92 (a sign of data quality; they stay in)
  outliers: 1 of 178 measurements (IDs hidden); see plot_sample_qc
  WARNING group mixed up with plate: 'Prediabetes' is missing from Inflammation F.I.F 21/03/2024. A plate difference can then look like a group difference: bridge the plates before comparing groups.
The odd measurement is sample 249 on plate 2: about 5 NPX too low on almost every protein, although it passed Olink's own QC (PASS). The dataset's authors removed it as well.
apply_qc#
Remove low-quality data. Every choice is a visible argument with a sensible default, and every removal is reported.
apply_qc(npx, *, drop_controls=True, drop_fail=True, drop_warnings=False, drop_empty=True,
         max_below_lod=None, repeats="prefer_pass_then_last", drop_samples=None,
         show_ids=True, verbose=True) -> pandas.DataFrame
Inputs
| Argument | Type | Default | Meaning |
|---|---|---|---|
npx |
DataFrame | — | table from read_npx / add_sample_info |
drop_controls |
bool | True |
remove control samples and control assays |
drop_samples |
list or dict | None |
samples you decided to remove (e.g. an outlier from qc_report). A list removes all measurements of those samples; a dict {sample ID: PlateID} removes only the one on that plate. IDs are compared after tidying, as in add_sample_info |
drop_empty |
bool | True |
remove measurements without any value |
drop_fail |
bool | True |
remove measurements with QC status FAIL (as Olink's own cleaning does) |
drop_warnings |
bool | False |
also remove measurements with QC status WARN; by default they are kept and counted in qc_report |
repeats |
str | "prefer_pass_then_last" |
for a sample measured more than once on the same plate: keep a passed measurement, and of those the last one (usually the rerun). Other options: "first", "last", "keep_all" |
max_below_lod |
float 0–1 | None |
remove assays below the LOD in more than this share. Default: keep all assays; removing them is usually not advised (see the note below) |
show_ids |
bool | True |
list sample IDs in the report |
verbose |
bool | True |
print the report |
The steps run in this order: controls → your samples → empty → FAIL → WARN (if asked) → measured twice on one plate → assays. Bridge samples are never removed as duplicates: the same sample on different plates is what bridging needs.
Output. The cleaned table, with the same columns. The list of removals is stored in
df.attrs["qc_applied"].
Why all assays are kept by default
Olink advises excluding assays with a large share of samples below the LOD, with the
cutoff "decided on a study basis", and also warns that some of the most distinct biomarkers
are low proteins. In practice cutoffs of 50% are common. signatomics reports assays above
75% as a sign of data quality and keeps them: an assay below the LOD in one group and above
it in another can be a biomarker, and assays without information drop out of the analysis
anyway. Look at qc_report(..., group=...) or plot_below_lod(..., group=...) first.
Errors. ValueError for an unknown repeats rule.
Example
Quality steps applied
  removed 2 measurements (no NPX value at all): 2 (IDs hidden)
  kept: 176 measurements of 143 samples, 92 assays
A sensitivity check is one argument away: so.apply_qc(data, drop_warnings=True).
Charts for this step#
Every chart returns a Plotly figure: interactive in a notebook, fig.write_image("chart.png") for
a static file, fig.write_html("chart.html") for a file you can share. See
the rules for charts.
plot_below_lod#
Horizontal bars showing the % of measurements below the detection limit, per protein.
plot_below_lod(npx, *, group=None, samples=None, on=None, max_below_lod=None,
               only_with_below=True) -> Figure
| Argument | Default | Meaning |
|---|---|---|
npx |
— | table with a LOD column |
group |
None |
one bar per group (at most 3), proteins sorted by the difference between groups |
samples, on |
None |
your sample metadata and its ID column, when group is a column there (as in qc_report) |
max_below_lod |
None |
draw a threshold line; proteins above it in red (what apply_qc(max_below_lod=...) would remove) |
only_with_below |
True |
show only proteins with at least one value below the LOD |
Errors. ValueError without a LOD column, or with more than 3 groups.
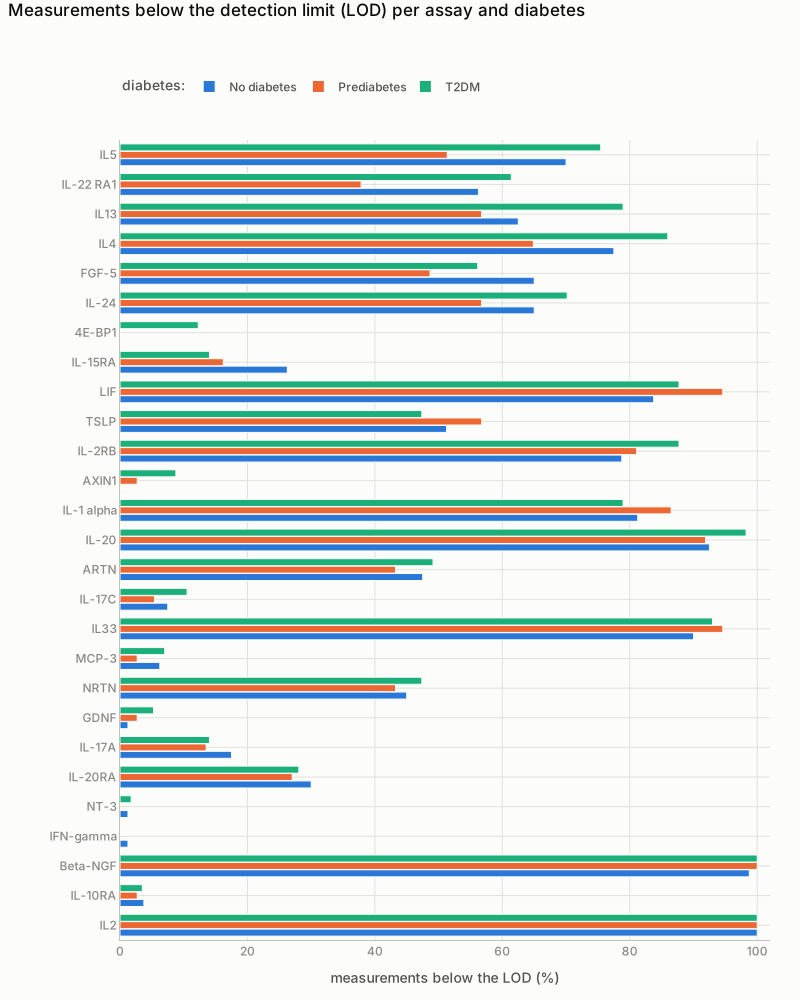
plot_below_lod(data, group="diabetes") on PAD000040. The proteins at the top are detectable in one group much more often than in another.
plot_npx_strip#
Every measurement as a dot, per protein, with groups side by side and the LOD as a red dot.
The dots of a protein lie on one vertical line, half transparent, so the chart stays narrow for
many proteins. Values below the LOD are drawn hollow. For panels with more than 96 proteins
it shows the 48 with the most values below the LOD, unless you choose proteins.
plot_npx_strip(npx, *, group=None, samples=None, on=None, proteins=None, per_row=48,
               order="name", show_ids=False, max_proteins=96) -> Figure
| Argument | Default | Meaning |
|---|---|---|
group |
None |
colour by this column (at most 3 groups) |
samples, on |
None |
your sample metadata and its ID column, when group is a column there |
proteins |
None |
list of protein names to show; default all |
per_row |
48 |
proteins per row; long lists are split over rows |
order |
"name" |
"name" (alphabetical) or "below_lod" (most below LOD first) |
show_ids |
False |
sample IDs in the hover text |
max_proteins |
96 |
above this many proteins, a selection is shown unless proteins is given (the subtitle says which) |
Errors. ValueError when no protein is left to plot, or with more than 3 groups.
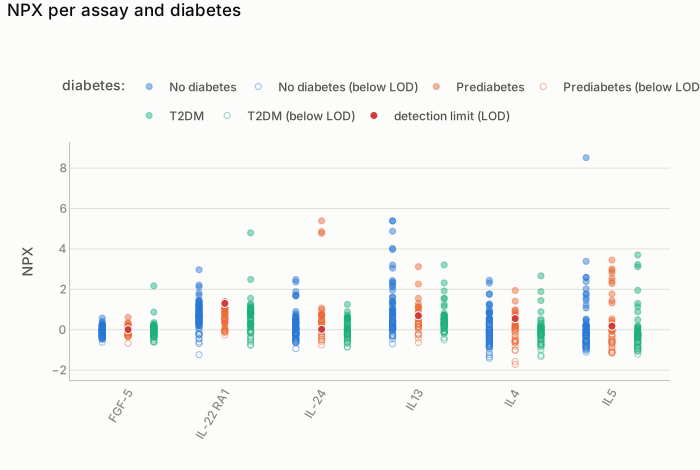
plot_npx_strip(bridged, group="diabetes", proteins=[...]): the six proteins whose detectability differs most between the groups. Hollow dots are below the detection limit (the red dot).
plot_group_by_plate#
Stacked bars showing how many people of each group were measured on each plate. If a group is missing from a plate, plate differences can look like group differences.
Input. group: a column of your sample metadata; samples and on look it up, as in
qc_report. Uses
qc_report(...).group_by_plate.
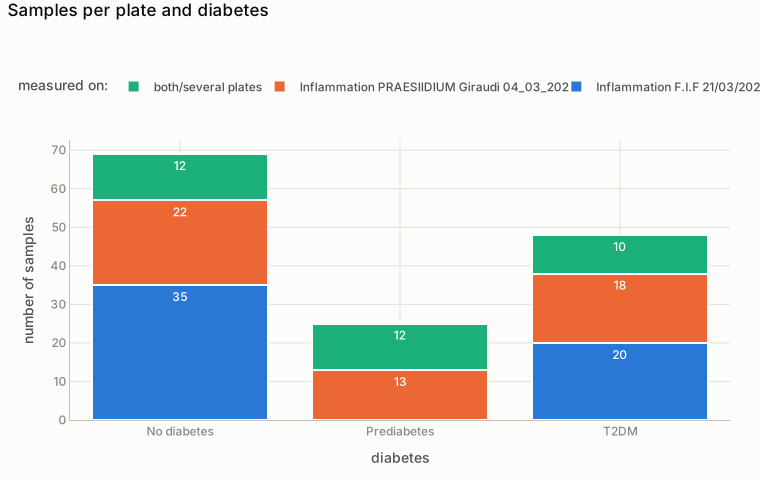
plot_group_by_plate(data, "diabetes") on PAD000040: nobody with prediabetes was measured on plate 1 alone.
plot_sample_qc#
Each measurement as a dot: its median (x) against its spread (IQR, y) over all proteins. This is
Olink's standard sample check. Dashed lines mark sd standard deviations, and outliers are drawn
as large red rings. Colour and marker shape show the plate; there is one panel per Olink panel
(up to 4).
The numbers behind it: qc_report(...).samples.
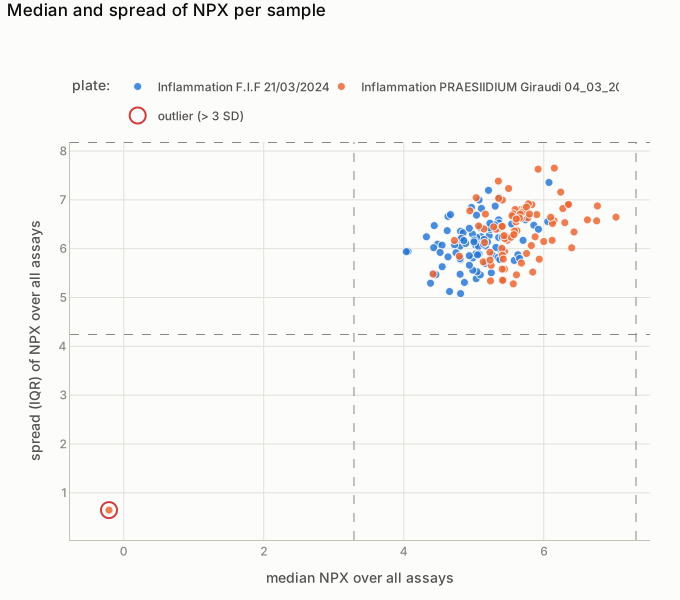
plot_sample_qc(data) on PAD000040: the red ring is sample 249 on plate 2, about 5 NPX too low on almost every protein.