Preprocessing · step 2
Quality control#
- Data import
- Quality control
- Bridging
- Sample metadata
Use this when you want to see what is wrong with your data before you analyse it, and remove what should stay out of the analysis.
1. Look: the quality check#
On the synthetic example file
Quality report
  controls (left out of the checks below; apply_qc removes them): 8 control samples (3 NEGATIVE_CONTROL, 3 PLATE_CONTROL, 2 SAMPLE_CONTROL)
  data: 40 samples, 92 assays, 1 plate
  QC status: 38 PASS, 1 WARN, 1 FAIL
  assays below the LOD in more than 75% of the samples: 11 of 92 (a sign of data quality; they stay in)
  outliers: 1 of 40 samples (P07); see plot_sample_qc
| Report line | What it means |
|---|---|
controls |
Olink's control samples on the plate; the checks leave them out |
QC status |
Olink's own flag for each sample: PASS, WARN (use with care) or FAIL |
below the LOD |
assays whose signal is too low to tell apart from background noise in more than 75% of the samples: a sign of data quality |
outliers |
samples whose median or spread over all assays lies more than 3 SD from the others |
A line appears only when there is something to report: duplicate sample IDs, bridge samples and control samples get a line of their own when your data has them.
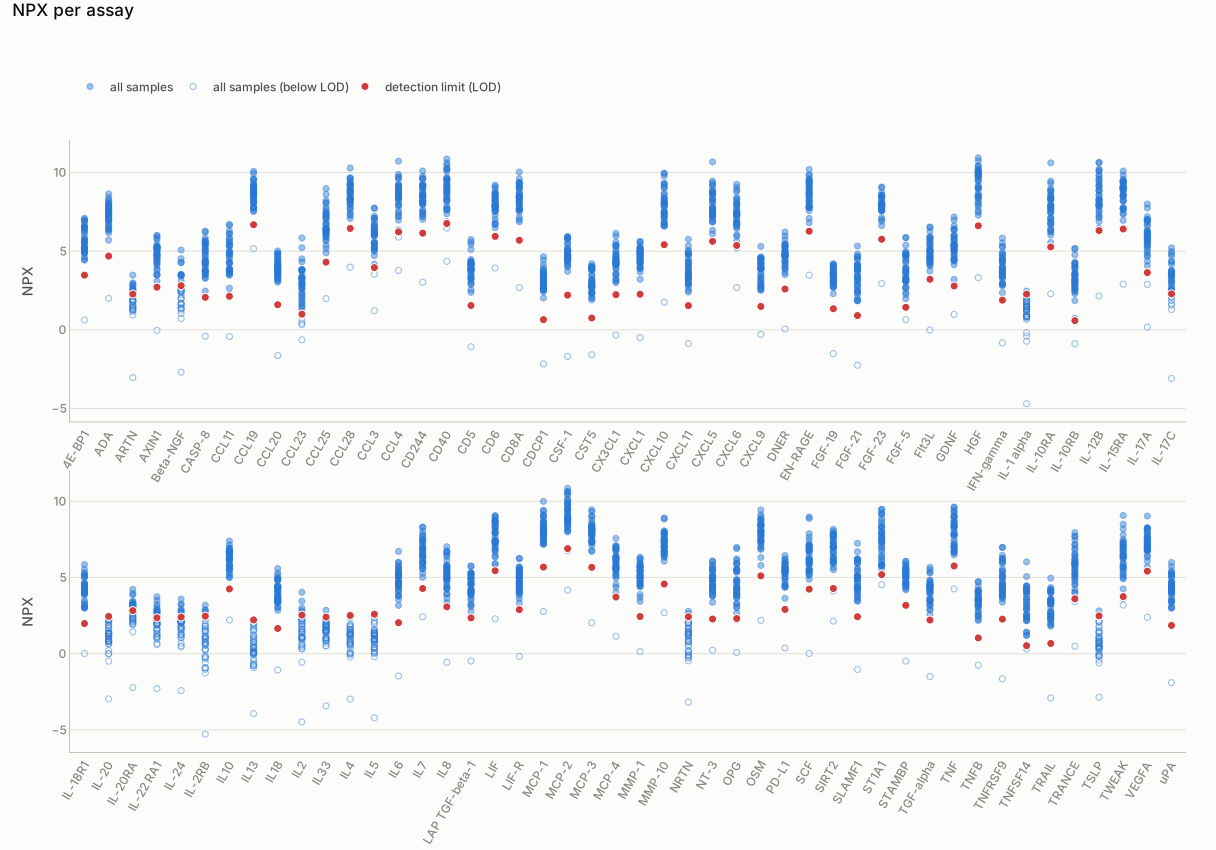
so.plot_npx_strip(data). Each dot is one sample's NPX value for one assay; the red dot is the assay's detection limit (LOD). Hollow dots lie below it. Assays such as IL4, IL5 and IL13 lie mostly below the LOD. Hover a dot for its value.
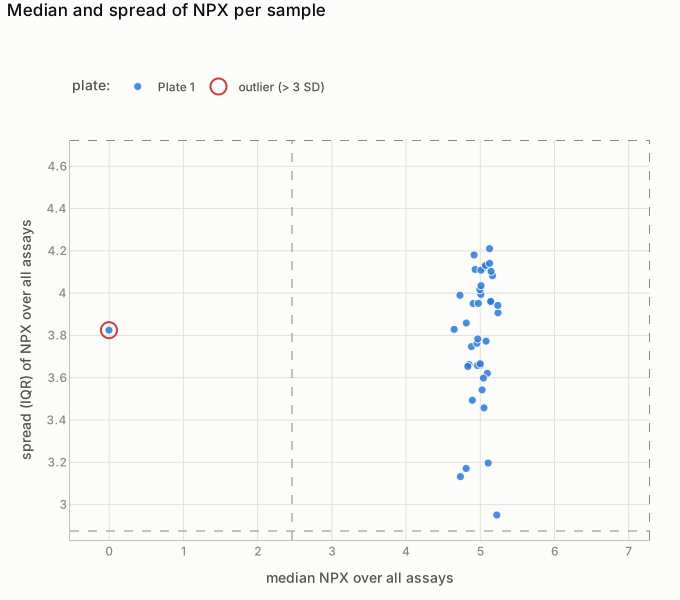
so.plot_sample_qc(data). Each dot is one sample: its median (left to right) and its spread (bottom to top) over all assays. P07, far to the left, reads low on every assay: a sign of a technical problem with that sample.
Do you have groups (cases and controls, treatments, ...)? Check them too
Give your sample metadata and the column with the groups. They are only looked up: your NPX data stays as it is.
samples = so.example_samples()      # your own: "my_sample_data.xlsx"
so.qc_report(data, group="group", samples=samples, on="sample_id")
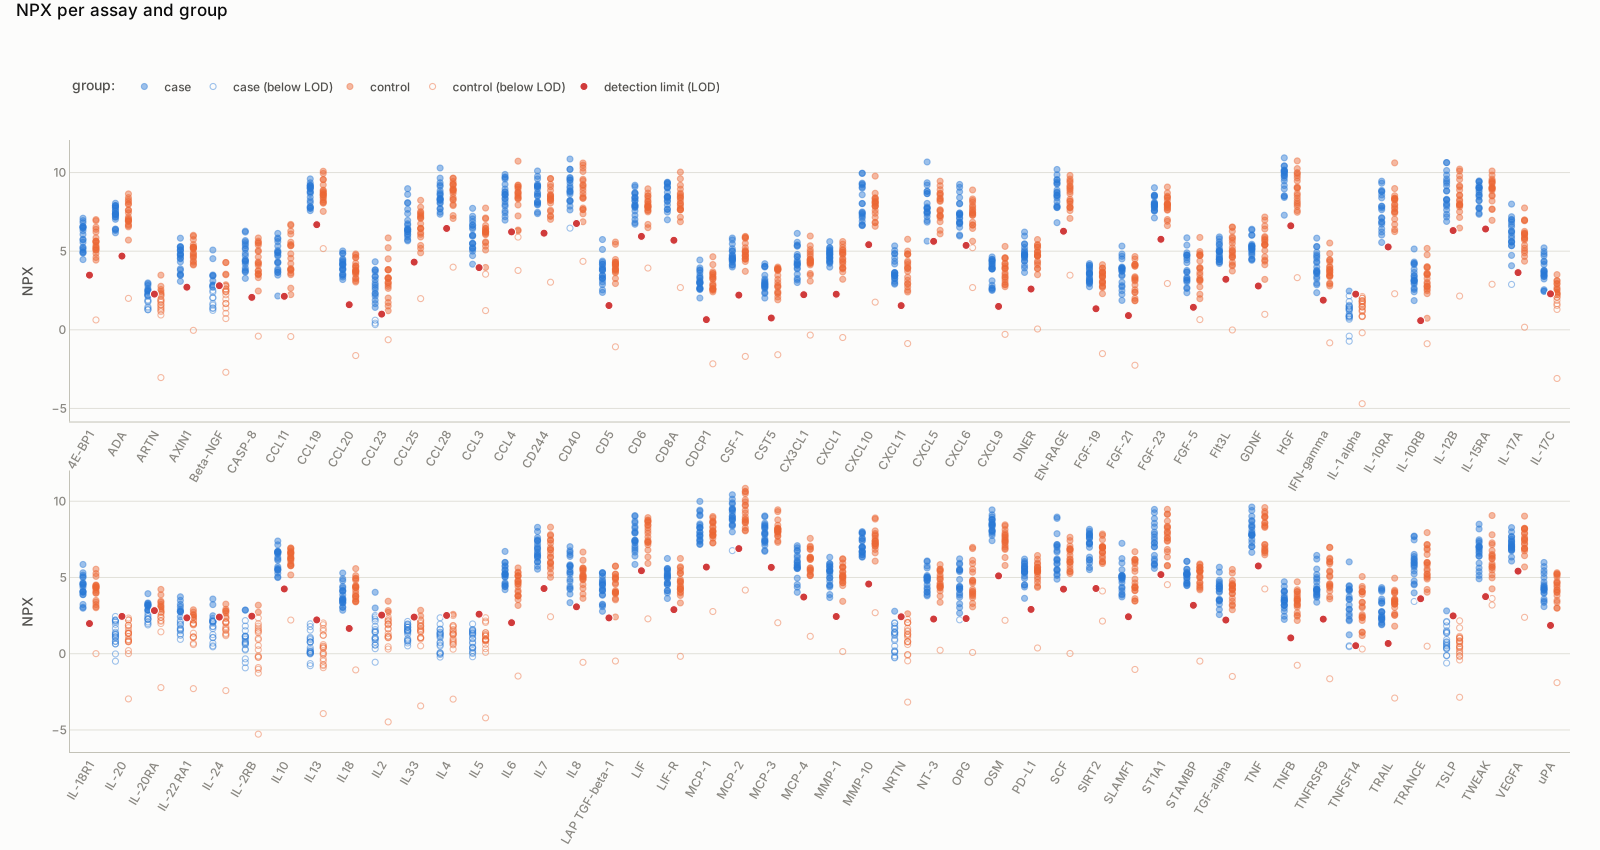
so.plot_npx_strip(data, group="group", samples=samples, on="sample_id")
The report then adds two checks when they find something: assays far more often below the LOD in one group than in another, and, with several plates, a group missing from a plate. On the example, one extra line:
below the LOD far more often in one 'group' group than another (by 30 percentage points or more): IL-17C - keep these: being undetectable in one group can itself be a signal
2. Act: apply your choices#
On the synthetic example file
By default apply_qc does what Olink's own cleaning does: it removes samples with QC status
FAIL and keeps those with WARN. It also removes control samples and control assays. Every
assay stays, and so does the outlier P07: those are your decisions.
Should I remove the WARN samples too?
Run your analysis with and without them: if the results agree, the warnings did not matter.
How do I remove an outlier I found, such as P07?
The report lists the removal. With several plates, drop_samples={"P07": "Plate 1"} removes
it from that plate only.
Should I remove the assays that are mostly below the LOD?
Usually not. Olink leaves the cutoff to each study and points out that some of the best biomarkers are low proteins; assays without information drop out of the analysis anyway. The report line is a sign of data quality. If your study needs it, the option is there:
Can I share the reports without sample IDs?
Yes: add show_ids=False to qc_report and apply_qc, and the reports give counts only.
Check yourself: why does qc_report change nothing?
So you can look first and decide yourself. Removing data changes your results; apply_qc
makes those changes, with every choice an argument you can see and every removal listed in
its report.
Every option: qc_report, apply_qc and the charts in Functions.