Statistical analysis · step 3
Correlate#
- Analysis table
- Compare groups
- Correlate
Use this when you want to know which assays rise or fall with a continuous variable, such as age, BMI or a lab value: every assay is tested, and the results are corrected for testing many assays at once.
from signatomics.stats import correlate, plot_volcano

result = correlate(table, "age")
plot_volcano(result)
On the synthetic example files, without P07 and P33
Reading the result#
protein  n      r  ci_low  ci_high      p   fdr
  CXCL9 57 -0.334  -0.552  -0.0735  0.011 0.467
TNFRSF9 57  0.319  0.0573     0.54 0.0155 0.467
   CST5 57  0.315  0.0528    0.537  0.017 0.467
| Column | What it means |
|---|---|
r |
the correlation, from -1 to +1: positive means the assay rises with age |
ci_low, ci_high |
the 95% interval for r |
p, fdr |
as in Compare groups: read the FDR, corrected for 92 assays |
In the synthetic data age plays no role, and the result says exactly that: CXCL9 has a p-value of 0.011, yet its FDR is 0.47. Among 92 assays, a few p-values this small are expected by chance alone. This is what the FDR protects you from.
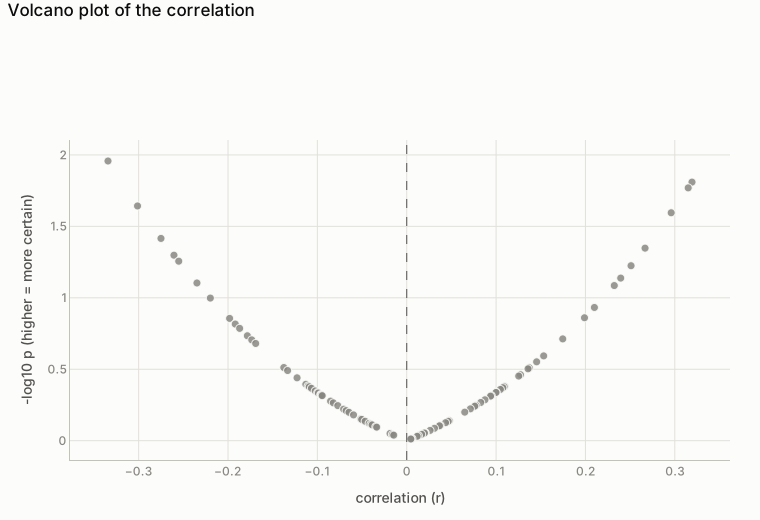
plot_volcano(result): every assay's correlation with age (left to right) and how certain it is (bottom to top). All dots are grey: no assay passes the FDR.
Spearman or Pearson?
Spearman (the default) follows any relation that keeps rising or falling, and a few extreme values hardly move it. Pearson measures a straight-line relation:
Choose before you look at the results, and use the same method for every assay.
Some samples have no value for the variable. What happens?
They are left out of that analysis and counted in the report ("left out: ... without a value").
Check yourself: why can a p-value of 0.011 still mean nothing?
Testing 92 assays is 92 chances. Even without any real relation, about one in a hundred tests gives p below 0.01 by chance. The FDR takes the number of tests into account.
Every option: correlate and plot_volcano in Functions.