Bridging Olink plates#
When a study is measured on several plates, or in several projects, the plates read slightly differently. Bridge samples, the same tube measured on both plates, show by how much.
For each protein, the median difference over the bridge samples is the plate shift. It is added to every sample on the other plate, which puts that plate on the scale of the reference plate. The reference plate itself stays as it is.
NPX is on a log2 scale, so bridging is an addition: a difference of 1 NPX is a factor 2. Only NPX data can be bridged. Skip this step when all samples are on one plate.
Like the quality step, bridging has two halves: look (bridge_check and the
charts), then act (bridge_plates).
Recommended order: apply_qc → bridge_check → bridge_plates → bridge_check again,
plus plot_bridge_pca.
Shared arguments#
All bridging functions take these arguments:
| Argument | Type | Default | Meaning |
|---|---|---|---|
batch |
str | "PlateID" |
the column that tells the plates apart. Use e.g. "Project" to bridge whole projects whose plate names may overlap |
reference |
plate name | None |
the plate that stays as it is; default the plate with the most samples |
bridges |
list of IDs | None |
the samples to use as bridges; default every sample on the reference and the other plate |
exclude_warnings |
bool | True |
use only bridge samples with QC status PASS (as Olink does) |
exclude_below_lod |
bool | False |
use only pairs where both values are above LOD |
Bridge samples are matched by tidy ID, so "B 01" on one plate matches "B_01" on the
other. A sample measured twice on the same plate is averaged first. Control samples and control
assays are never used.
bridge_check#
Look at the difference between plates using the bridge samples. It changes nothing. Run it before bridging (how big is the difference?) and after (is it gone?).
bridge_check(npx, *, batch="PlateID", reference=None, group=None, samples=None, on=None,
             bridges=None, exclude_warnings=True, exclude_below_lod=False, min_bridges=8,
             tolerance=0.1, show_ids=True, verbose=True) -> BridgeCheck
Inputs. The shared arguments, plus:
| Argument | Type | Default | Meaning |
|---|---|---|---|
npx |
DataFrame | — | all plates in one table (pd.concat separate files) |
group |
str | None |
a column of your sample metadata: checks whether the bridge samples cover every group, and whether the shift is the same in each group |
samples, on |
None |
your sample metadata and its ID column, when group is a column there: only looked up, as in qc_report |
|
min_bridges |
int | 8 |
fewer bridge samples than this gives a warning; proteins with fewer usable pairs are flagged in .factors |
tolerance |
float | 0.1 |
a protein whose shift is larger than this (NPX) counts as "still shifted" |
show_ids |
bool | True |
list sample IDs |
verbose |
bool | True |
print the report |
Output. A BridgeCheck object, which prints as a report:
| Attribute | What it holds |
|---|---|
.lines |
the report lines |
.differences |
one row per bridge sample, protein and non-reference plate: sample (the tidy ID), the protein columns, plate, reference, NPX_reference, NPX_plate and difference (= plate − reference). The reference used is in .attrs["reference"] |
.proteins |
per plate and protein: shift (median difference), spread (IQR), bridges (number of pairs) |
.samples |
per plate and bridge sample: shift (median over proteins), to find odd bridge samples |
.factors |
per plate and protein: the adjustment that bridge_plates adds (see below) |
.by_group |
with group: per protein, the shift in each group and their difference |
The factors table holds, for each protein and each plate other than the reference:
| Column | What it holds |
|---|---|
plate, reference |
the plate that will be adjusted, and the reference |
OlinkID, Assay |
the protein |
adjustment |
NPX to add to this protein on this plate (empty if no bridging pair) |
bridges |
number of bridging pairs used |
spread |
IQR of the bridge differences: noise that bridging cannot remove |
few_bridges |
True when bridges < min_bridges |
You can inspect it, save it (.to_csv) and apply it later with
bridge_plates(..., factors=...).
For each plate, the report says:
- how many bridge samples there are;
- the typical shift and its range over proteins;
- how many proteins are shifted by more than
tolerance; - the noise (the typical spread);
- which bridge samples shift differently from the others: more than 3 robust SDs and 0.25 NPX away, which can mean a mix-up or a degraded tube;
- with
group, the shift in each group.
Checking after bridging
On a table that is already bridged, the shifts are about 0 by construction, because the
same samples were used to compute the adjustment. The report says so. The independent check
is plot_bridge_pca.
Errors
ValueError: there is no NPX column, or only one plate.KeyError:batchorgroupis missing from the columns.ValueError:referenceis missing from the plates.
The table .differences is empty, and the report warns, when no sample is on two plates.
Example (PAD000040, the two raw plate files)
chk = so.bridge_check(clean, group="diabetes", samples="sample_manifest.xlsx", on="FIF ID",
                      show_ids=False)
chk.factors.sort_values("adjustment").head()
Bridging check
  reference: Inflammation F.I.F 21/03/2024
  Inflammation PRAESIIDIUM Giraudi 04_03_2025: reads +0.52 NPX compared with Inflammation F.I.F 21/03/2024 (median over assays; per assay -0.96 to +2.30), measured on 29 bridge samples
    assays shifted by more than 0.1 NPX: 83 of 92 - bridging needed
    noise: the bridge samples' differences spread 0.44 NPX per assay (typical IQR); bridging removes the shift; this noise stays
    bridge samples that shift differently from the others (a mix-up or a degraded tube?): 2 (IDs hidden)
  'diabetes' among the bridge samples: No diabetes: 9 of 69; T2DM: 9 of 48; Prediabetes: 10 of 25
    overall shift on Inflammation PRAESIIDIUM Giraudi 04_03_2025 per group: No diabetes +0.56; Prediabetes +0.57; T2DM +0.53 (largest difference 0.04 NPX)
    assays whose shift differs by more than 0.5 NPX between groups: IL13, IL-22 RA1, TNFB, 4E-BP1, IL-24, IL2 - with few bridge samples per group this is often noise; look at them before trusting group differences for these assays
bridge_plates#
Put every plate on the scale of the reference plate.
bridge_plates(npx, *, factors=None, batch="PlateID", reference=None, bridges=None,
              exclude_warnings=True, exclude_below_lod=False, min_bridges=8,
              verbose=True) -> pandas.DataFrame
Inputs. The shared arguments, plus:
| Argument | Type | Default | Meaning |
|---|---|---|---|
npx |
DataFrame | — | all plates in one table, best after apply_qc |
factors |
DataFrame | None |
a factors table to apply, e.g. bridge_check(...).factors checked or saved earlier; computed here when None |
min_bridges |
int | 8 |
proteins with fewer pairs are named in the report |
verbose |
bool | True |
print the report |
Output. The same table, with:
NPXandLOD,MaxLODshifted by the adjustment, so a value below LOD stays below LOD;NPX_unbridgedandLOD_unbridged: the original values;Bridge_adjustment: the NPX added to the row. It is 0 on the reference plate, and empty if the protein had no bridging pair; in that case the value is left unchanged and the report warns.
The report is stored in df.attrs["bridge_report"].
Errors
ValueError: the table is already bridged (it has aBridge_adjustmentcolumn). Bridge the original table instead.ValueError: there is noNPXcolumn, or only one plate.KeyError:batchis missing from the columns.ValueError:referenceis missing from the plates.
Example
Bridging report
  reference (kept as it is): Inflammation F.I.F 21/03/2024
  Inflammation PRAESIIDIUM Giraudi 04_03_2025: 92 assays adjusted by their adjustment factor (median -0.52 NPX, from -2.30 to +0.96), each from 29 bridge samples
  NPX and LOD shifted together, so 'below the LOD' stays the same; the original values are in NPX_unbridged and LOD_unbridged
  check: plot_bridge_pca(before, after) - each bridge sample's two measurements should now lie together
Charts for this step#
Every chart returns a Plotly figure; see the rules for charts.
plot_bridge_shift#
For each protein, how much higher the other plate reads than the reference, for the same samples:
- grey dots: single bridge samples;
- coloured marker: the median, which is the shift
bridge_platesremoves; - bar: the middle 50%.
Before bridging the markers sit away from 0; after bridging they sit on 0.
plot_bridge_shift(npx, *, batch="PlateID", reference=None, bridges=None,
                  exclude_warnings=True, exclude_below_lod=False,
                  show_ids=False) -> Figure
Arguments as in the shared arguments. At most 3 plates besides the reference.
Errors. ValueError when there are no bridge samples, or more than 3 other plates.
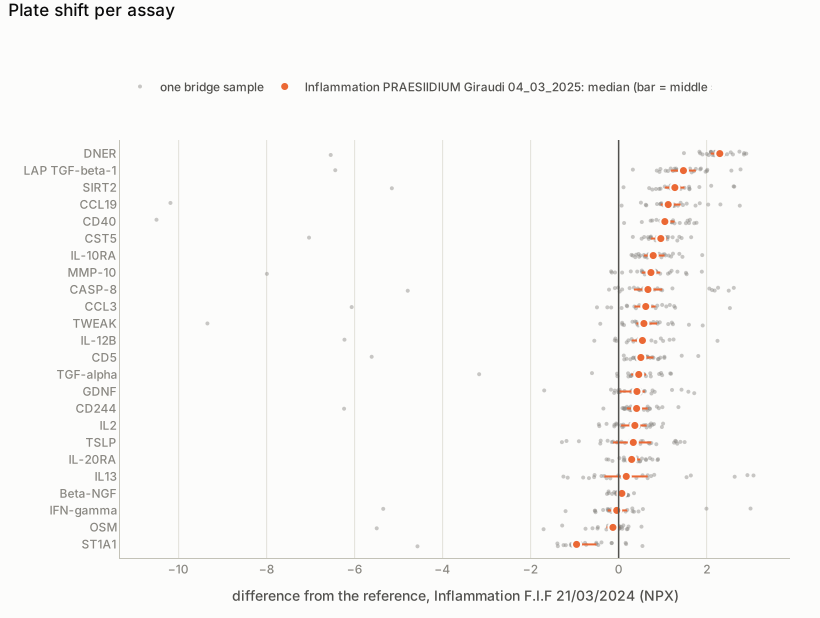
plot_bridge_shift(clean) on PAD000040, before bridging; 24 of the 92 proteins, spread over the range of shifts.
plot_bridge_bland_altman#
Bland-Altman plots of the bridge samples, one panel per protein: how much the plates differ, before (or after) bridging. Each point is one bridge sample: the mean of its two measurements (x) against their difference, other plate minus reference (y).
plot_bridge_bland_altman(npx, proteins=None, *, batch="PlateID", reference=None,
                         exclude_warnings=True, show_ids=False, cols=3) -> Figure
| Argument | Default | Meaning |
|---|---|---|
proteins |
None |
1 to 12 proteins, one panel each. Default: three, chosen from the data: the largest shift up, about none (among well-measured assays), the largest shift down |
show_ids |
False |
sample IDs in the hover text |
The solid line is the median difference: the plate shift that bridging removes. The dotted lines are the limits of agreement in a robust form, median ± 1.96 robust SD (1.4826 × the median absolute deviation) instead of the classic mean ± 1.96 SD: with about a dozen bridge samples, one broken tube would otherwise widen them. That tube then lies outside the limits. After bridging the median lies on 0.
Errors. ValueError for more than 12 proteins, or proteins without bridge samples.
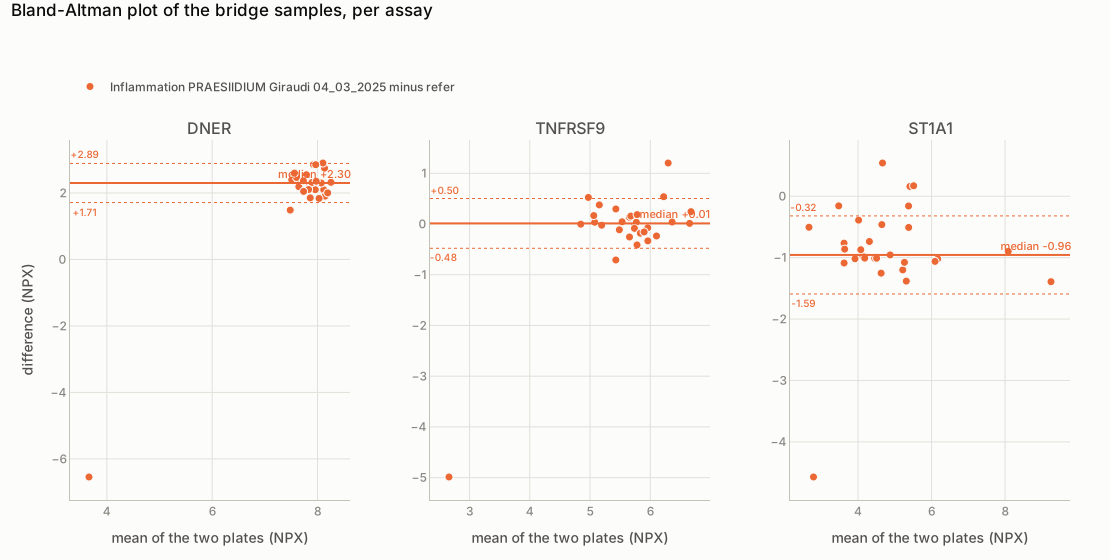
plot_bridge_bland_altman(clean) on PAD000040: three proteins whose plate shift differs (the solid lines). The point far below in each panel is sample 249, the broken tube.
plot_bridge_scatter#
Bridge samples, with NPX on the reference plate (x) against the other plate (y), one panel per protein. On the dashed diagonal both plates agree; dotted lines mark each plate's LOD.
plot_bridge_scatter(npx, proteins, *, batch="PlateID", reference=None,
                    exclude_warnings=True, show_ids=False, cols=3) -> Figure
| Argument | Default | Meaning |
|---|---|---|
proteins |
— | 1 to 12 protein names (Assay) |
cols |
3 |
panels per row |
Errors. ValueError for 0 or more than 12 proteins, or a protein without bridging pairs.
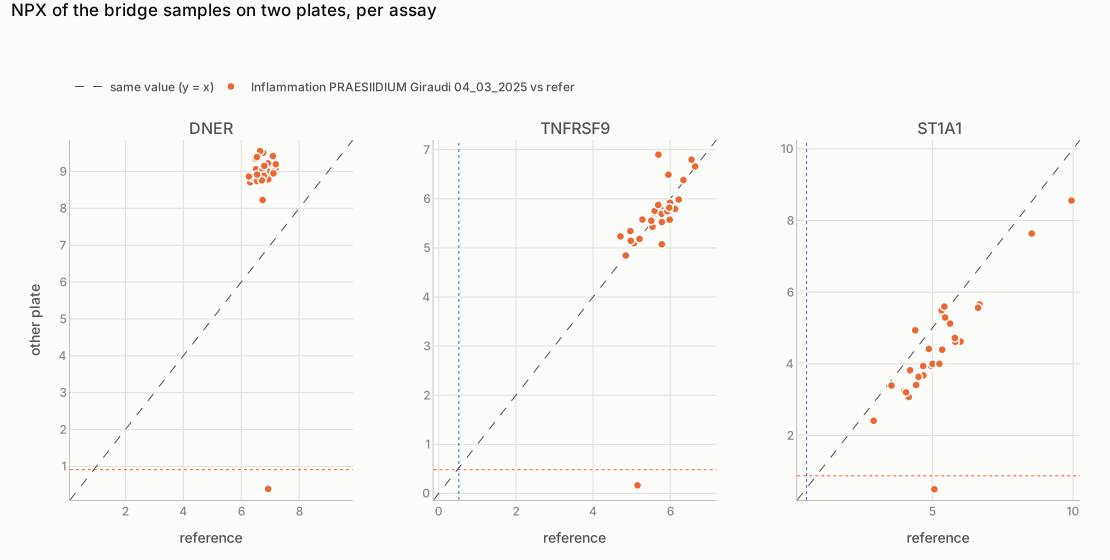
plot_bridge_scatter(clean, ["DNER", "TNFRSF9", "ST1A1"]) on PAD000040: plate 2 reads DNER higher, TNFRSF9 the same, ST1A1 lower. The dot at the bottom of each panel is sample 249, a broken tube.
plot_bridge_pca#
A PCA of the bridge samples, coloured by plate, before and (optionally) after bridging. Each bridge sample appears once per plate, and a thin line joins its measurements. After bridging, the plates should overlap and the lines shrink.
This is the independent check of bridging. The shift was fitted per protein; the PCA looks at all proteins together. The subtitle gives the median distance between a sample's measurements, before and after.
plot_bridge_pca(before, after=None, *, batch="PlateID", samples="bridges",
                exclude_warnings=True, show_ids=False) -> Figure
| Argument | Default | Meaning |
|---|---|---|
before |
— | table before bridging |
after |
None |
the same table after bridge_plates; adds a second panel |
samples |
"bridges" |
"bridges" (only samples on more than one plate) or "all" |
Proteins with more than half of their values missing are left out. Other missing values are filled with the protein's median, and proteins are scaled before the PCA.
Errors. ValueError with fewer than 3 measurements, or an unknown samples value.
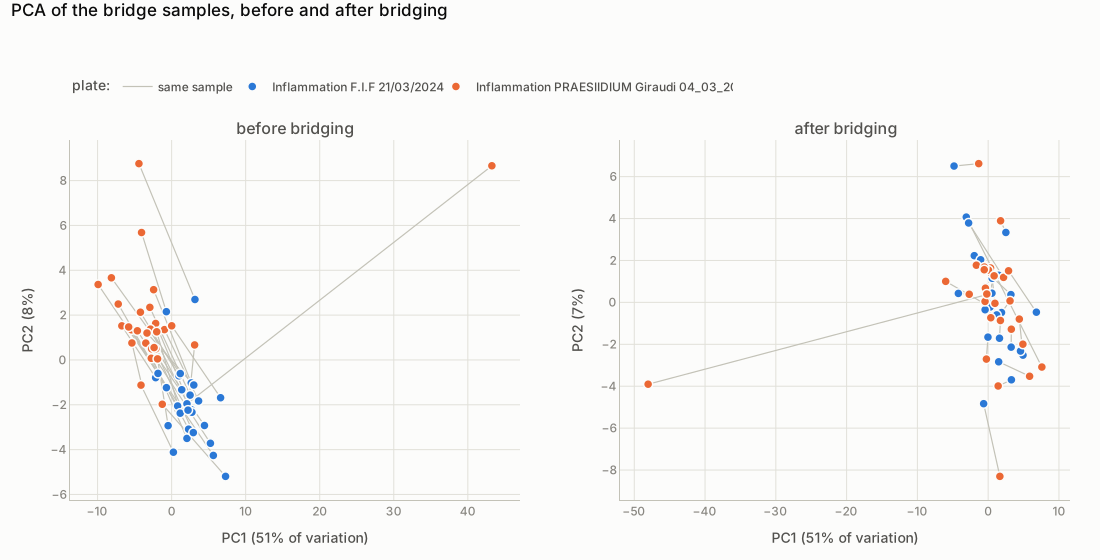
plot_bridge_pca(clean, bridged) on PAD000040: a sample's two measurements lie 6.5 apart before bridging (median) and 1.8 after. The point far from the rest is sample 249, the broken tube.